Why advanced stats?
Goals and points are what win games, but they're a noisy way to judge a player or team. A goal can come from a fluky bounce off a skate, and a great shift can end with nothing on the scoreboard because the goalie made a big save. Over ten or twenty games, luck like that can make an average player look like a star, or the other way around.
Shots and scoring chances happen far more often than goals, so they settle down faster and tell you more about who is actually controlling play. A team that keeps generating good looks will usually start scoring; a team winning while getting badly outshot usually cools off.
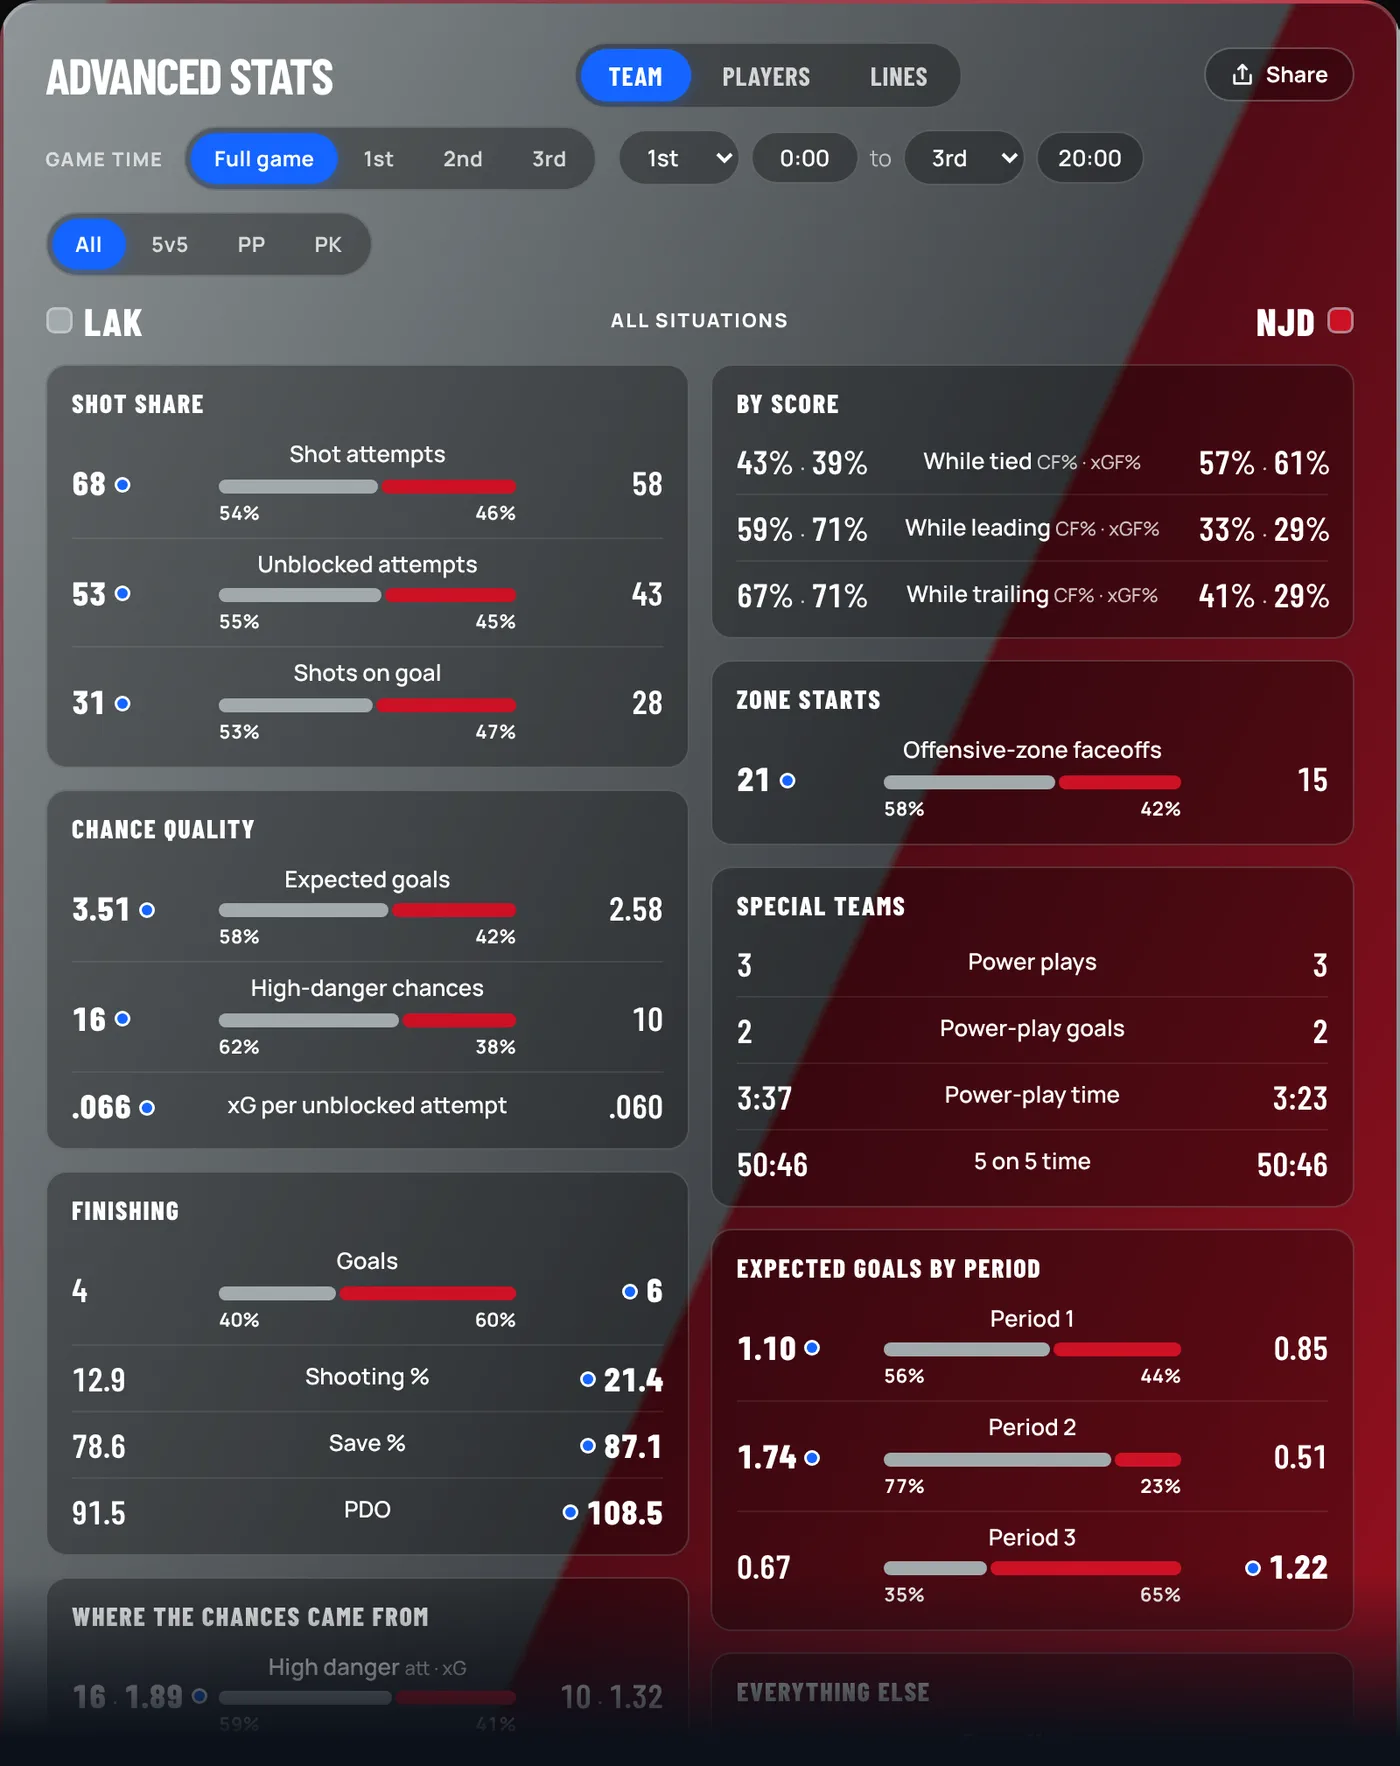
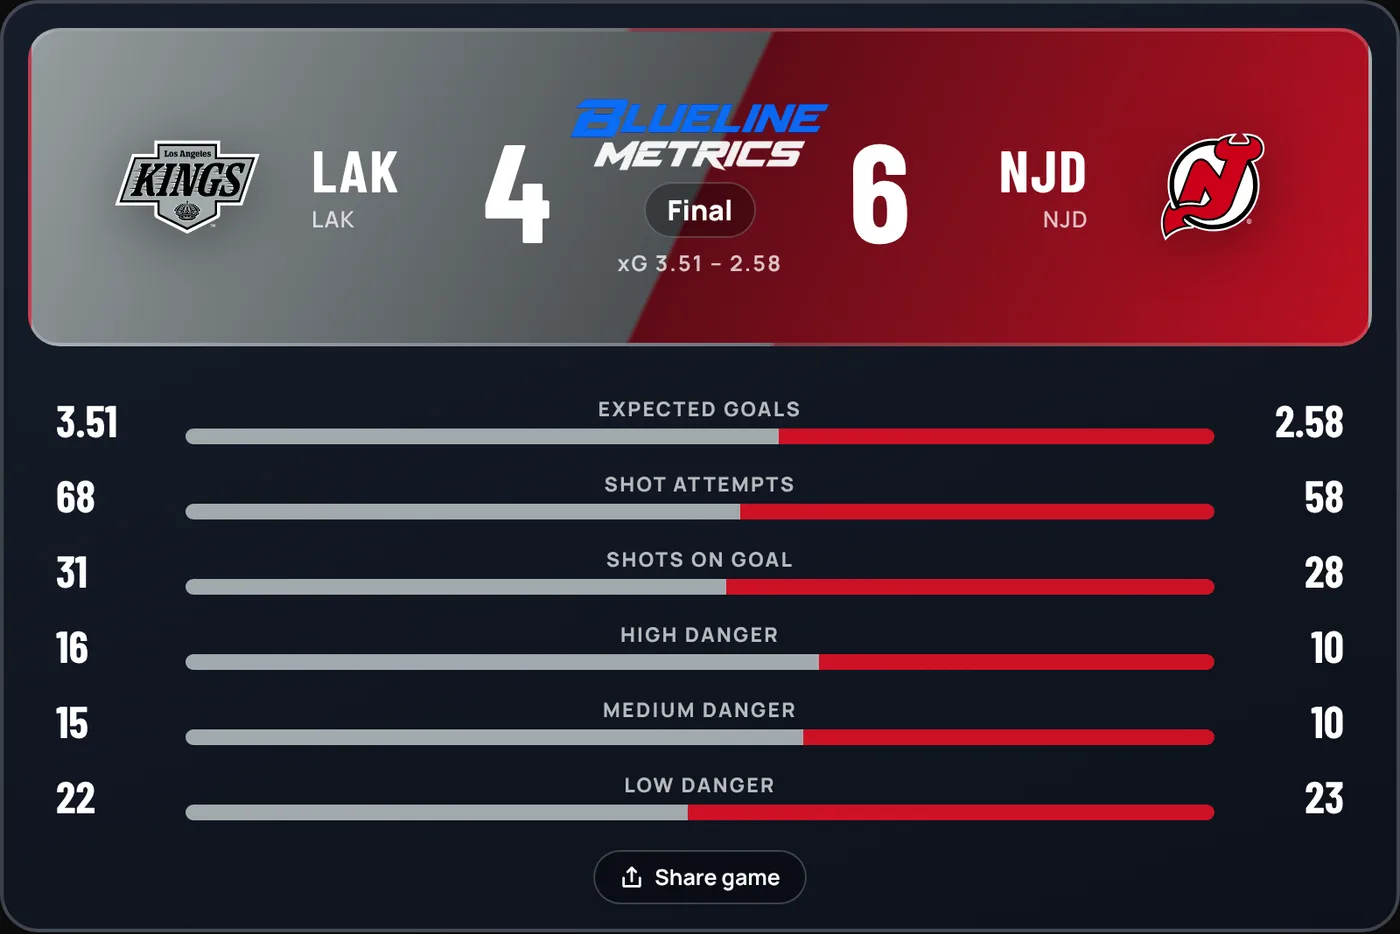
Take one real game from the live tracker: on March 14, 2026, Los Angeles out-attempted New Jersey, 54.0% to 46.0%, and won the expected-goals battle 3.51 to 2.58. New Jersey still won 6-4. The stats below explain how both of those things can be true, and which one is more likely to repeat.
Try it on the site: Live trackerCorsi and Fenwick (CF%, FF%)
Corsi counts every shot attempt: shots on goal, shots that miss the net, shots that get blocked, and goals. CF (Corsi for) is your team's attempts, CA (Corsi against) is the other team's. CF% is your share: CF divided by CF plus CA.
So 50% means the attempts were even. Above 50% means your team was shooting more than it was being shot at. For a player, CF% counts the attempts while he's on the ice, so a center who sits at 55% is on the ice for a lot more offense than defense.
Why does this measure puck possession? You can't shoot without the puck. A team that attempts more shots is almost always the team carrying the puck into the offensive zone and keeping it there.
Fenwick is the same idea without blocked shots, so it counts only unblocked attempts. FF% is its share. Some analysts prefer it because blocking shots is partly a skill of the defending team.
Expected goals (xG, xGA, xG%)
Corsi treats every attempt the same, but a shot from the blue line and a tap-in at the side of the net are not the same. Expected goals fixes that. Every unblocked shot gets a value between 0 and 1: the chance a shot like it becomes a goal.
The BluelineMetrics model looks at the shot's distance and angle, the shot type (wrist, slap, backhand, tip and so on), whether it was a rebound or came off the rush, and the game situation. A rebound in the slot might be worth 0.30 xG, while a point shot through traffic might be 0.03. Across the 2025-26 shots on the site's player shot maps, attempts from right in front of the net averaged 0.16 xG and shots from the point averaged 0.02.
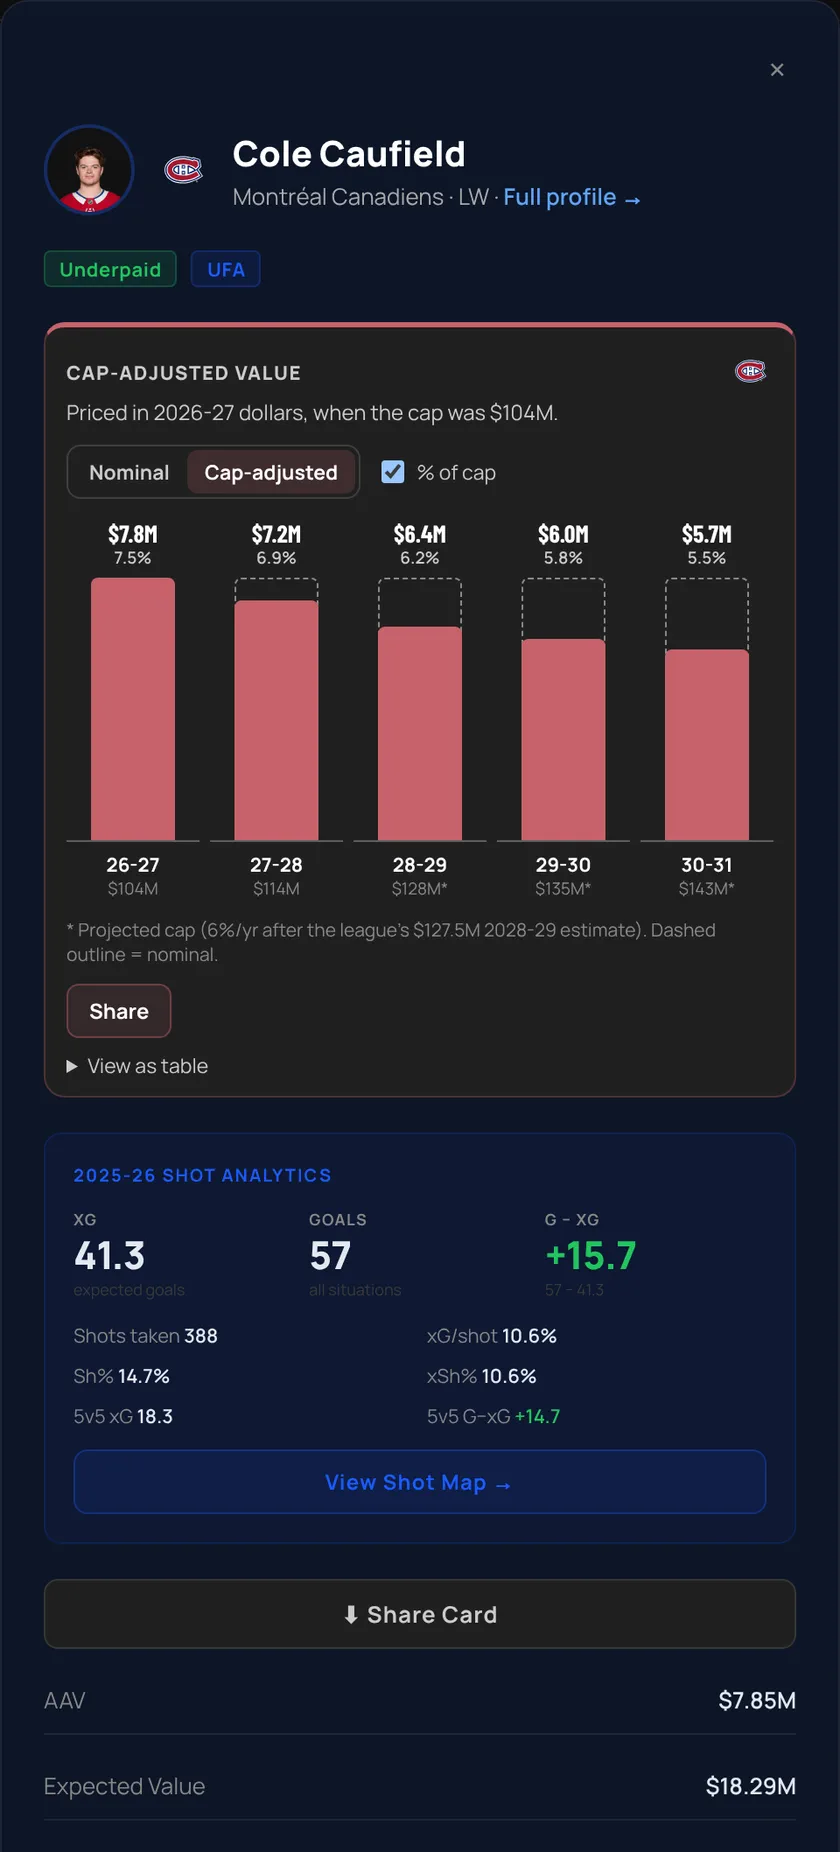
Add them up and you get xG (for) and xGA (against); xG% is your share. Compare xG with actual goals and you see finishing: in 2025-26, Cole Caufield scored 57 non-empty-net goals on 41.3 xG, +15.7 above expected.
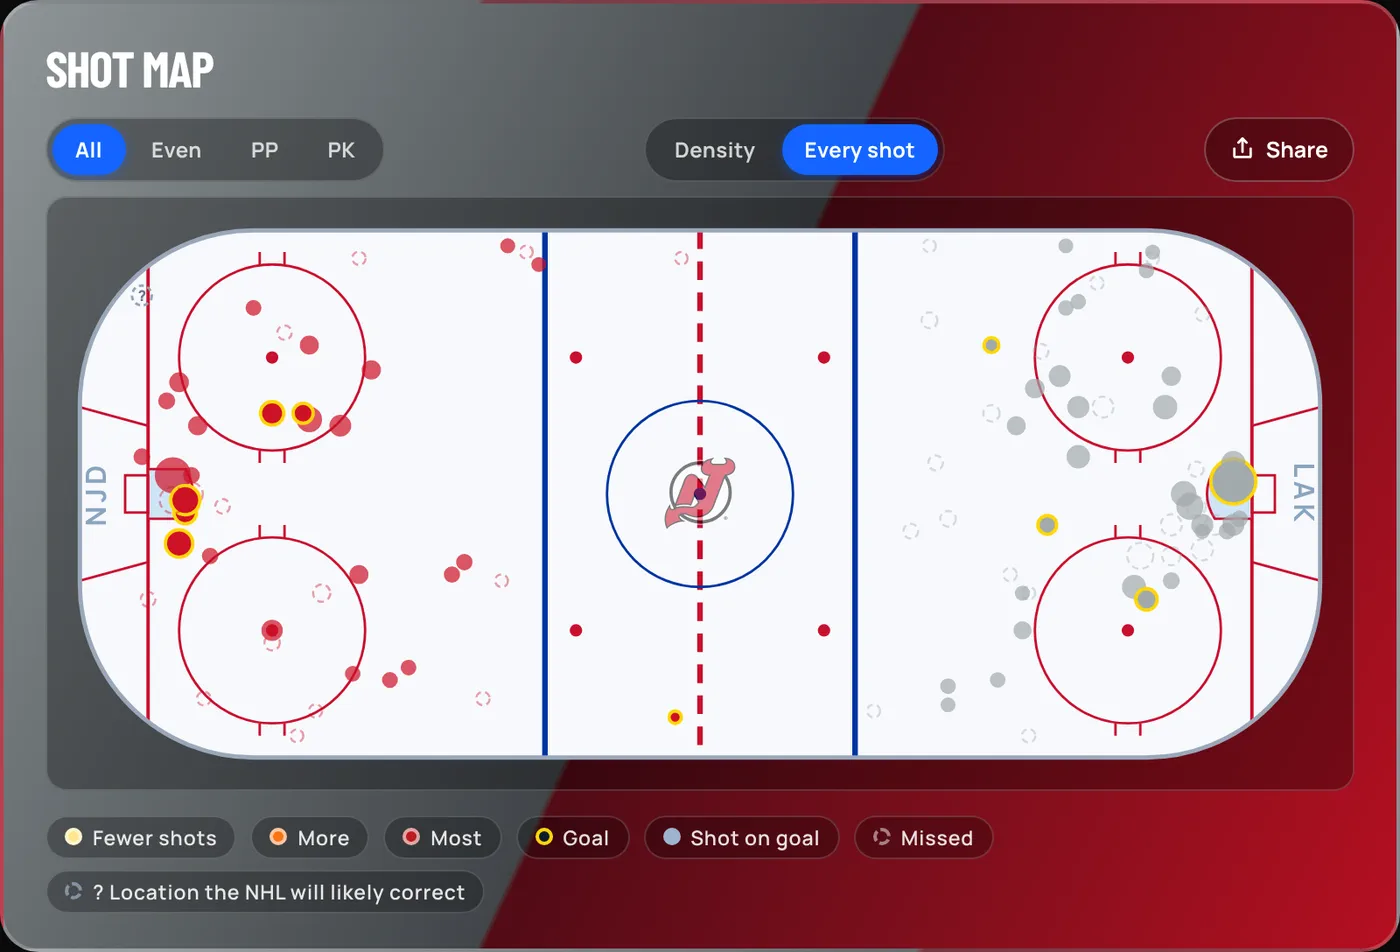
The live tracker runs this model on every shot as it happens, keeps a running xG total for each team, and sizes the dots on its shot map by xG.
How good is our xG? And goalie-adjusted xGA
An xG model is only as good as how closely it tracks real goals. The usual test is simple: for every team, add up its expected goals for a season and compare with the goals it actually scored, then measure how closely the two move together across the league with a correlation (R, where 1.0 would be perfect). Do the same for goals against.
On the three seasons from 2023-24 to 2025-26 (96 team-seasons), BluelineMetrics team xG scores like this against the official goal totals, next to a public comparison of other models on the same seasons:
| Model | Goals for, all | Goals against, all | Goals for, 5-on-5 | Goals against, 5-on-5 |
|---|---|---|---|---|
| HockeyStats | .796 | .748 | .703 | .708 |
| BluelineMetrics xG | .786 | .747 | .687 | .681 |
| MoneyPuck | .766 | .741 | .644 | .677 |
| Puckalytics | .754 | .711 | .625 | .640 |
| Evolving Hockey | .694 | .655 | .626 | .643 |
| Natural Stat Trick | .685 | .642 | .631 | .649 |
| BluelineMetrics, goalie-adjusted | — | .754 | — | .698 |
Three adjustments get our team numbers there, each fitted only on earlier seasons:
- Empty nets count. A shot at an empty net gets its own model, based on distance and angle. Player xG still leaves them out, because a 150-foot empty-netter tells you nothing about a shooter.
- Score and venue. A team protecting a lead takes fewer, better shots, and a team chasing a game piles up volume. Each attempt is weighted by how much its score state and home or away pulls a team away from an even split, the same idea MoneyPuck uses.
- Rink bias. Every arena has its own scorekeeper, and some record shots closer to the net, or more missed shots, than others. Comparing what two clubs generate in a building with what they generate everywhere else measures that bias, and we take out half of it (all of it overcorrects).
We tested more ideas than we kept. Discounting rebound flurries, recalibrating by power-play type, retraining the model and adding blocked shots all made the results worse or no better. Two others raised the numbers only by quietly using the result: weighting score state very heavily (teams that score a lot spend more time leading) and discounting shots that missed the net (every goal hits the net). We left those out.
In October 2026 we checked the model against the NHL's own puck tracking, which follows every goal frame by frame, and found it had been reading the play just before a shot from the wrong end of the rink about four times in ten. That is fixed. The model is now better at telling which shots go in (on 2025-26 shots it never trained on, log loss improved 0.5% and AUC rose from .751 to .754), but season-long team totals barely change: measured the same way, the old model's numbers in the table were within .01 of these.
Goalie-adjusted xGA is a separate number. Plain xG deliberately ignores who is in net, which is why every model tracks goals against less well than goals for: a hot or cold goalie moves goals away from expected. Goalie-adjusted xGA multiplies each shot by the record of the goalie who faced it, his goals allowed against our own expected goals over every earlier season (2015-16 on, shrunk heavily toward average for goalies with short records). Nothing from the current season is used. It answers a slightly different question, "how many should this team have allowed with this goalie", so it sits beside xGA rather than replacing it.
Try it on the site: Team rankings, BlueLine xGHigh-danger chances
A high-danger chance is the kind of shot that makes fans stand up: close to the net, from the middle of the ice, often off a rebound or a quick pass. Counting them is a simple way to see which team is getting to the dangerous areas instead of just firing from the outside.
On BluelineMetrics, high danger is about location. A high-danger chance is an unblocked shot attempt (a shot on goal, a miss or a goal) taken from the slot: a 22-foot-wide area in front of the net that runs 20 feet out from the goal line, then narrows to a point at the top of the faceoff circles. Blocked shots don't count, because the league records where the block happened, not where the shot came from.
The same definition is used everywhere on the live tracker. The scoreboard's High danger count and the Advanced Stats tab's high-danger chances count exactly the same shots: HDCF (high-danger chances for) and HDCA (against), with HDCF% your share. The scoreboard also shows Medium danger, the wider area between the circles, and Low, everything else.
In the Los Angeles-New Jersey game, the Kings had 16 of those high-danger chances to the Devils' 10. That's usually a winning recipe, which brings us to goaltending and luck.
GSAx: goals saved above expected
GSAx compares the goals a goalie actually allowed with the goals an average goalie would have allowed on the same shots, using expected goals. If the shots he faced added up to 150 xG and he let in 135, his GSAx is +15. Positive is good; zero is average.
Why not just use save percentage? Because save % treats every shot the same. A goalie behind a leaky defense faces more rebounds and backdoor passes, so his save % can look ordinary even when he's playing well. A goalie behind a tight team can post a shiny save % on easy shots.
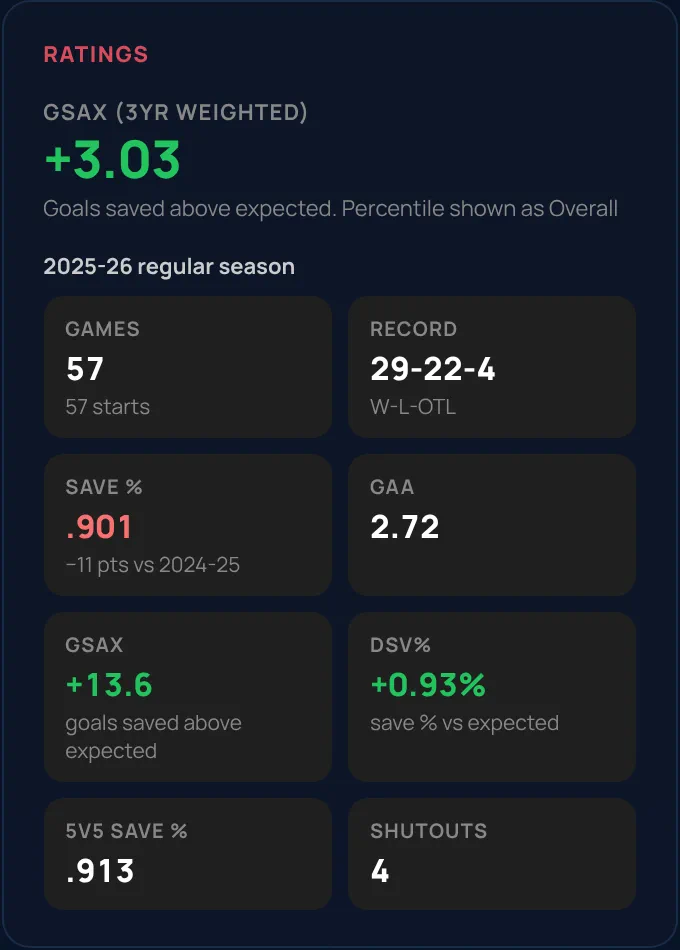
John Gibson is a good example. His 2025-26 save percentage was .901, barely above the league's .896, which doesn't jump off the page. But the shots he faced were tough, and he finished at +13.6 GSAx, the ninth-best in the league. Dustin Wolf stopped almost exactly the same share of shots (.899) and finished at −2.6. Nearly the same save percentage, about 16 goals apart, because Gibson's shots were the harder ones.
PDO and regression
PDO is simply a team's shooting percentage plus its save percentage (on shots on goal). Because every goal scored is a goal allowed for somebody else, the league as a whole always averages out to about 100.
A team or player well above 100 is getting great finishing, great goaltending, or both. That can be partly skill, but over a full season most teams drift back toward 100. Analysts call that regression to the mean. A team winning with a PDO of 104 and a CF% of 46 is a classic "due to cool off" team.
In our example game, New Jersey's PDO was 108.5 and Los Angeles's was 91.5: the Devils saved 87.1% of the shots on goal while the Kings saved 78.6%. Over one night that decides games. Over 82, the team that keeps winning the shot and xG battles is the better bet.
Try it on the site: PDO in the live trackerWAR: wins above replacement
WAR tries to boil a player's whole contribution into one number: how many wins he adds compared with a replacement-level player.
Replacement level means the kind of player any team can get at any time for close to the league minimum: a call-up from the minors or a depth free agent. So WAR asks, "If this player got hurt and we plugged in a fill-in, how much worse would we be?"
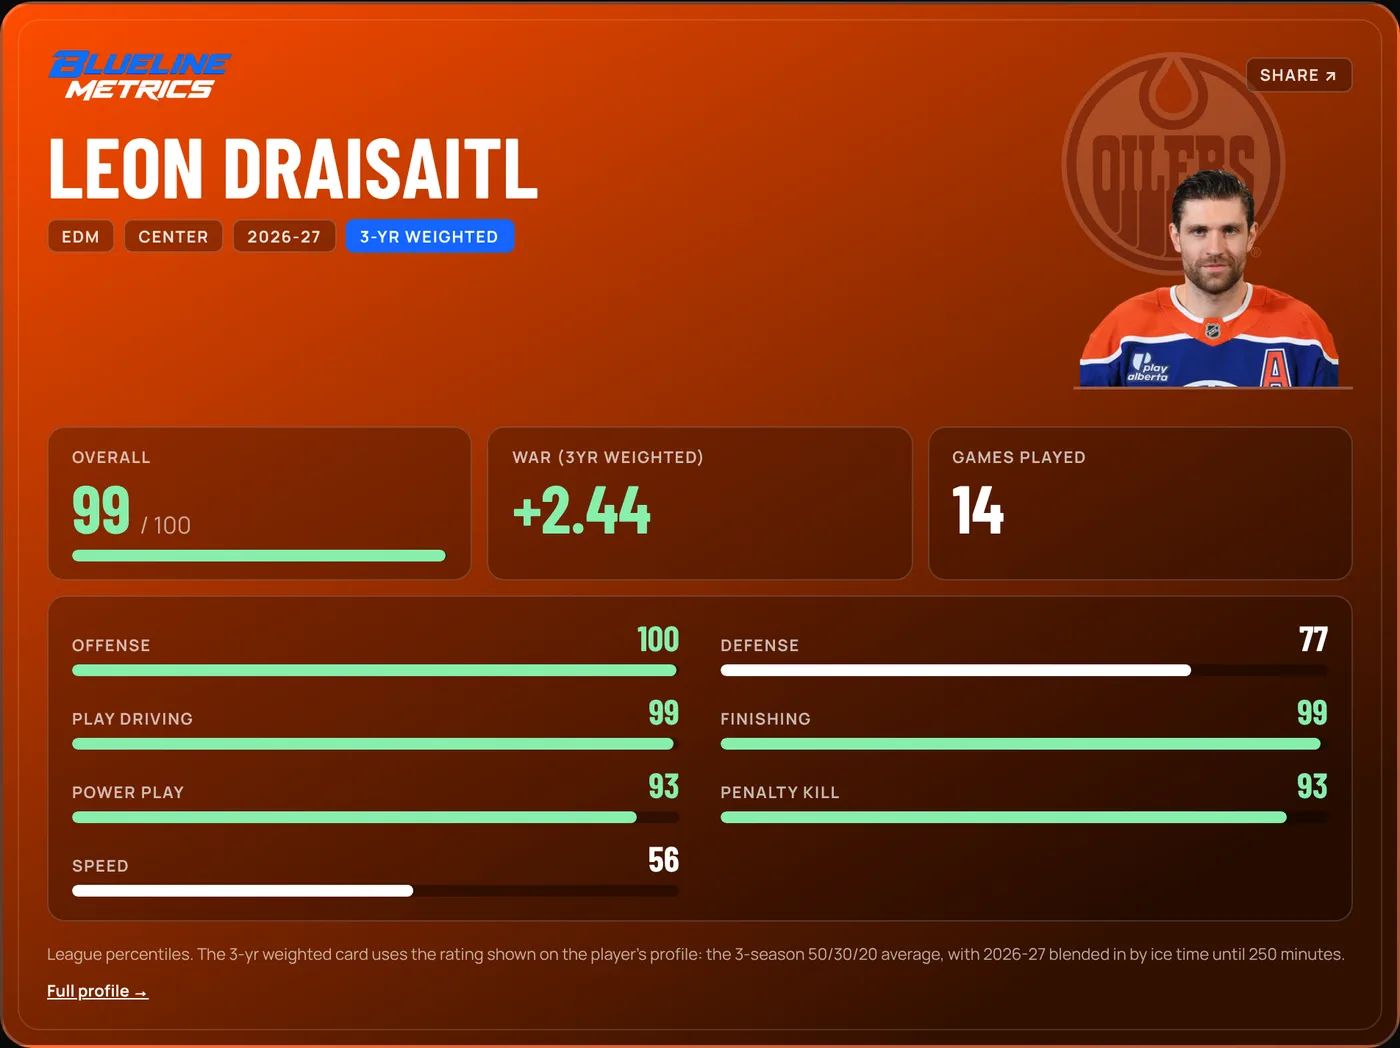
On BluelineMetrics, a skater's WAR is built from the same offense, defense, play-driving, finishing and special-teams pieces as the ratings, weighted toward recent seasons. The scale runs small: Leon Draisaitl leads all skaters at +2.47, and the typical rated skater sits at −0.25, right around replacement. For goalies, the card shows GSAx in that spot instead.
Per-60 rates, and 5-on-5 vs. all situations
A top-line center might play 21 minutes a night while a fourth-liner plays 10. Comparing their season totals isn't fair. Per-60 rates fix that by scaling a stat to 60 minutes of ice time: goals per 60, shot attempts per 60, shots against per 60 for a goalie. Now the fourth-liner who scores at a first-line rate in limited minutes stands out.
Game situation matters too. Most of a game is played at 5-on-5, and that's the fairest place to compare players, because power plays inflate offense and penalty kills crush it. All situations includes everything, which is right for totals but can flatter power-play specialists.
Caufield again: 33 of his 2025-26 goals came at 5-on-5, on 18.3 5-on-5 xG. That's the part of his finishing that doesn't depend on the power play. On the site, the live tracker's All / 5v5 / PP / PK buttons split every game this way, and the NHL Edge page shows per-60 rates such as goalie shots against per 60.
Try it on the site: NHL EdgeWin probability
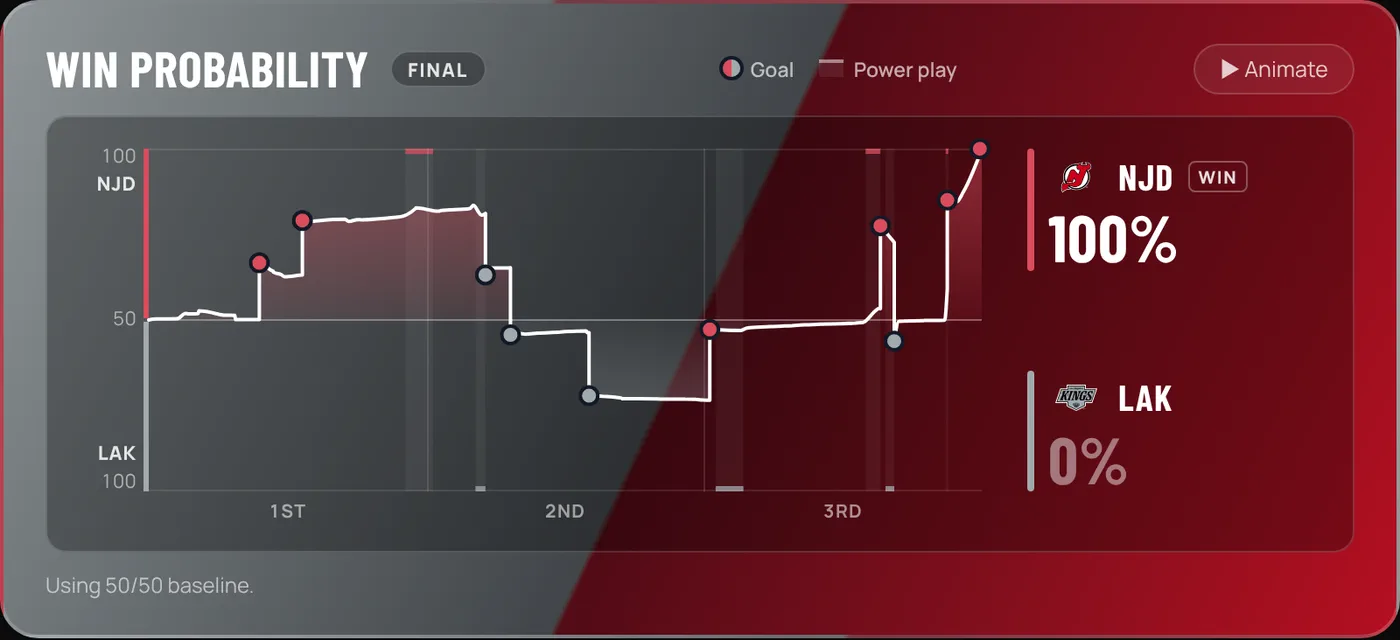
Win probability is the chance each team wins the game from where things stand right now. The live tracker draws it as a line through the game: above the middle, the home team is ahead on the odds; below it, the visitors are. Goals are marked on the line and power plays are shaded.
On the BluelineMetrics live tracker it starts from the site's pregame model (so the favorite starts ahead), then updates with the score, the time left, the manpower situation (a power play or an empty net) and the flow of expected goals. A one-goal lead with two minutes left is worth a lot more than a one-goal lead early in the first period, and a team that keeps piling up xG while trailing gets some credit for it. The pregame numbers are kept only for the current slate, so a game from an earlier night, like the one below, starts at 50/50.
The Los Angeles-New Jersey game swung both ways. New Jersey led 2-0 after the first, Los Angeles scored three in the second to lead 3-2, and it was tied 4-4 with just over six minutes left before a New Jersey power-play goal and an empty-netter. When the game ends, the line finishes at 100% for the winner.
How BluelineMetrics ratings work
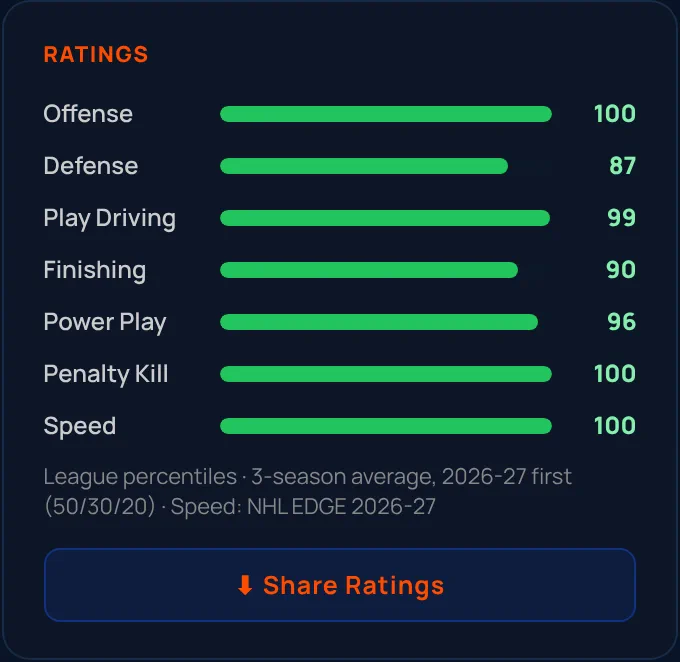
Every rating on the site is a percentile from 0 to 100, compared with players at the same position. A 90 means the player is ahead of 90% of players at his position in that area; 50 is average. Goalies are rated on GSAx.
Skaters get an overall rating plus component ratings:
- Offense and defense: on-ice impact creating and preventing chances.
- Play driving: whether the shot and chance share tilts his team's way when he's out there.
- Finishing: scoring more than his chances would predict.
- Power play and penalty kill: special-teams impact.
- Speed: top skating speed, from NHL EDGE tracking.
The current rating blends the last three seasons, weighted toward the most recent, so one hot or cold month doesn't swing it too far. Connor McDavid, for example, rates 100 overall with offense 100, play driving 99 and defense 87.
Contract value: Underpaid, Fair, Overpaid
The contract model estimates what each player's on-ice value is worth per season in cap dollars, based on his ratings, age and position and on what comparable players actually signed for. That's his expected value. Then it compares it with his real cap hit.
- Underpaid: the cap hit is well below the expected value.
- Fair: the cap hit falls inside the expected range.
- Overpaid: the cap hit is well above it.
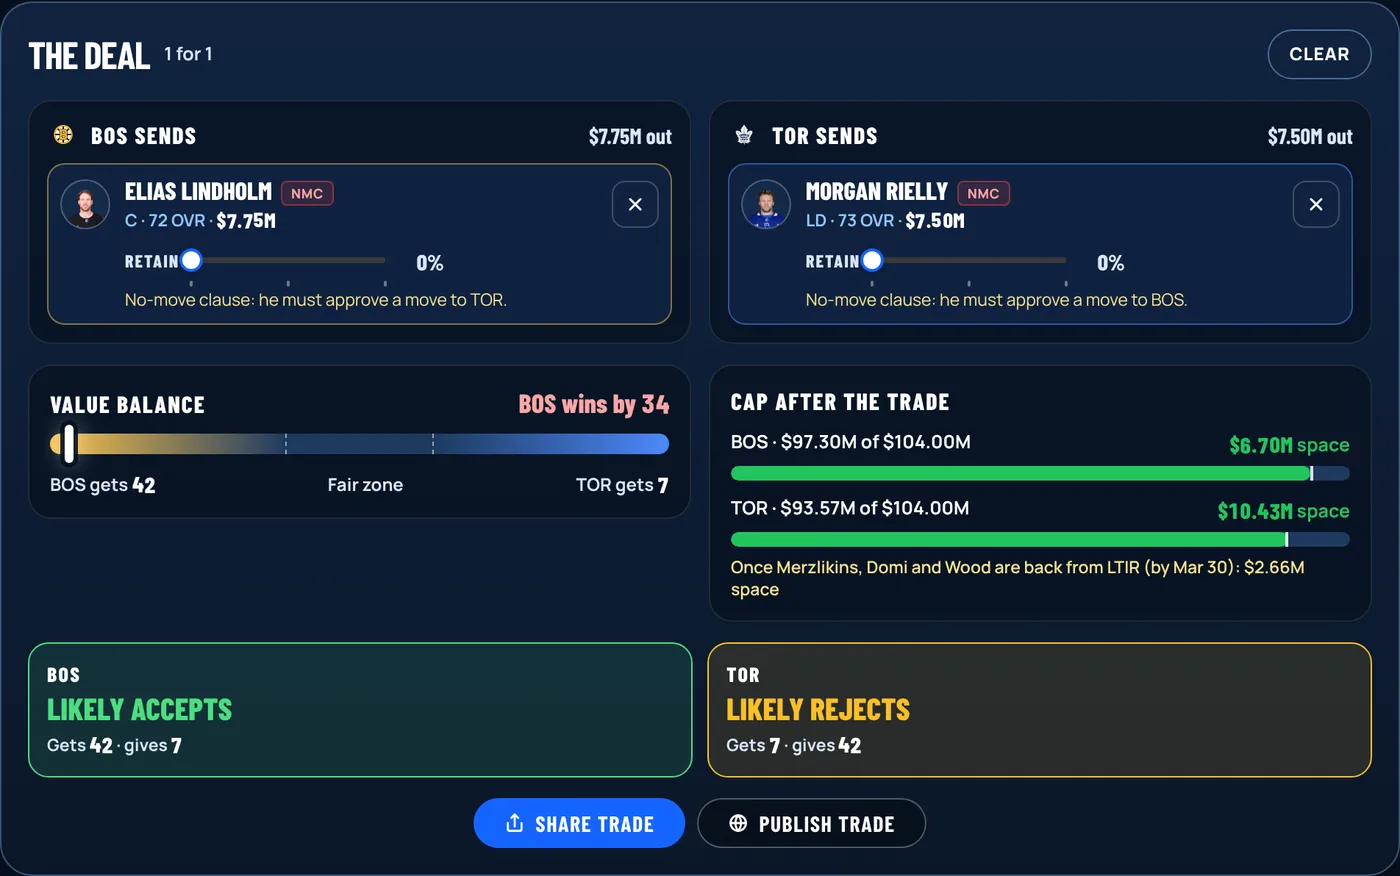
Cole Caufield carries a $7.85M cap hit, but the model expects $18.29M, so he's Underpaid. Elias Lindholm, at $7.75M against an expected $3.69M, is Overpaid. In the 2026-27 database, 364 contracts are rated Underpaid, 456 Fair and 152 Overpaid. Remember it's about value for money, not talent: a superstar on a huge deal can be excellent and still Overpaid.
The same numbers power the Trade Machine, which adds up the contract value moving each way and tells you who wins the deal. Below, Boston sends Lindholm to Toronto for Morgan Rielly, whose cap hit is about the same, and wins the value easily, because the model rates Rielly's play as worth far more than Lindholm's.
Glossary
| Term | Plain meaning | Average |
|---|---|---|
| CF / CA | Corsi for / against: every shot attempt, including blocked and missed shots. | - |
| CF% | Your share of all shot attempts while you're on the ice. | 50% is even |
| FF% | Same as CF%, but only unblocked attempts (Fenwick). | 50% is even |
| xG / xGA | Expected goals for / against: how many goals the chances were worth. | - |
| xGF% | Your share of the expected goals in the game. | 50% is even |
| G − xG | Goals scored minus expected goals: finishing above or below the chances. | 0 is average |
| HDCF | High-danger chances: unblocked attempts from the slot, the area in front of the net out to the top of the faceoff circles. | - |
| Sh% / Sv% | Shooting percentage and save percentage, on shots on goal. | - |
| PDO | Shooting % plus save %. A rough luck meter. | About 100 |
| GSAx | Goals saved above expected: goals a goalie prevented vs. an average goalie. | 0 is average |
| Talent-adjusted xG / xGA | Expected goals priced for who shot and who was in net: each shot times the shooter's finishing over his four previous seasons and the goalie's form (his previous seasons plus this season's games before that one), both pulled toward average. A separate number; plain xG stays the main one. | - |
| Shooter-adjusted xG | A player's own xG times his finishing over the four seasons before, pulled toward average (earlier seasons only). | - |
| WAR | Wins above replacement: value vs. an easily found fill-in player. | 0 is replacement |
| Per 60 | A stat scaled to 60 minutes of ice time, to compare players fairly. | - |
| 5v5 | Five skaters a side, no power play or penalty kill. | - |
| Rating (0-100) | A BluelineMetrics percentile vs. players at the same position. | 50 is average |
| Expected value | What the model thinks a player's play is worth per season in cap dollars. | - |
Examples use 2025-26 data and 2026-27 contracts from BluelineMetrics, updated with the site's data. More questions? See the FAQ.